When something goes wrong on a Windows Server whether it’s performance degradation, unexpected restarts, authentication failures, Group Policy issues, or application crashes the first and most powerful troubleshooting tool at your disposal is the Windows Server Event Viewer.
Event Viewer is often misunderstood or overlooked by junior administrators because it can feel noisy or overwhelming. But for experienced sysadmins, it is the single most important source of actionable diagnostic information inside any Windows environment.
In this comprehensive guide, we’ll break down exactly how to use Windows Server Event Viewer to troubleshoot server issues, what logs matter, how to filter events, how to correlate issues across logs, and advanced techniques every admin should master.
What Is Windows Server Event Viewer?
Event Viewer is a built-in Windows Server tool that collects and stores detailed information about operating system events, security activity, hardware health, system services, applications, and more.
Why Event Viewer Matters
- Helps quickly identify causes of system crashes, performance issues, login failures, and service interruptions
- Acts as a forensic source for tracking security incidents
- Logs detailed application- and service-level errors
- Offers timestamps, error codes, and system context that guide troubleshooting
- Helps correlate incidents across multiple servers
If you’re managing Windows Server 2012 R2, 2016, 2019, 2022, or later, Event Viewer is your primary diagnostic companion.
Understanding the Most Important Windows Event Logs
Event Viewer organizes logs into several key sections. Not all of them matter equally for troubleshooting.
Here are the ones every administrator must understand:
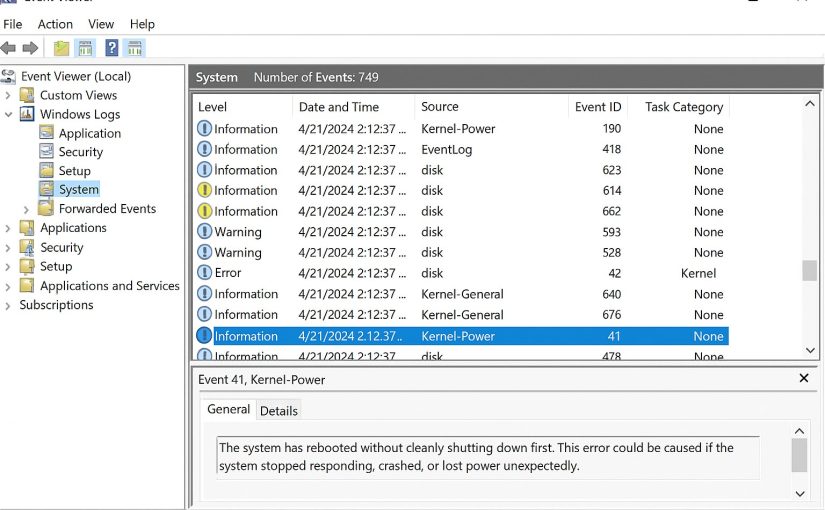
1. System Log (Critical for Server Health)
This log records system-level messages:
- Driver failures
- Service start/stop issues
- Kernel warnings
- Hardware alerts (disk, memory, NIC)
- System reboot and shutdown messages
Look for:
- Event ID 41 – Kernel-Power (unexpected shutdown or crash)
- Event ID 6008 – Previous shutdown was unexpected
- Event ID 7000–7099 – Service control manager errors
- Event ID 1014 – DNS client issues
2. Application Log (For App & Service Troubleshooting)
Application developers and services write here. Common entries:
- SQL Server errors
- IIS crashes
- .NET Runtime exceptions
- Backup software failures
- Exchange Server warnings
Important event IDs:
- Event ID 1000 – Application error
- Event ID 1309 – ASP.NET errors
- Event ID 18456 – SQL login failure
3. Security Log (Critical for Auditing & Investigations)
This log helps identify:
- Account lockouts
- Login failures
- Privilege escalation attempts
- Group membership changes
- Failed RDP attempts
Common event IDs:
- 4625 – Failed login
- 4624 – Successful login
- 4740 – Account locked out
- 4672 – Admin privilege assignment
4. Setup Log
Useful during:
- Windows updates
- Feature/role installation
- Server migrations
5. Forwarded Events (For Centralized Logging)
If you’re using a Windows Event Collector (WEC) server or SIEM, logs from remote servers will appear here.
How to Navigate Event Viewer Like a Pro
Open Event Viewer
You can access it through:
- Server Manager → Tools → Event Viewer
- Or run:
eventvwr.msc
Use Custom Views
Custom Views help isolate critical issues quickly.
Recommended filters:
- Critical + Error events only
- Specific event sources (e.g., Service Control Manager, Kernel-General)
- Event IDs relevant to your environment
Advanced Filtering Techniques
1. Filter by Event Level
Filter for Critical, Error, and Warning during troubleshooting.
2. Filter by Event Source
Examples:
Kernel-PowerDiskNtfsDNS Client EventsUser Profile Service
3. Filter by Event ID
Example scenario: “Why is my server rebooting randomly?”
Search for:
- Event ID 41
- Event ID 6008
- Event ID 1074
XML Filters (Advanced)
When you need complex logic, use the XML tab.
Example: Filter for critical disk errors only:
<QueryList>
  <Query Id="0" Path="System">
    <Select Path="System">
      *[System[(Level=1 or Level=2) and (EventID=7 or EventID=51)]]
    </Select>
  </Query>
</QueryList>
Most Common Server Problems & How to Diagnose Them With Event Viewer
1. Server Running Slow / High CPU / High RAM Usage
Check:
- System → Event ID 2004 (Resource Exhaustion Detector)
- Application → .NET Runtime errors
- System → Driver or disk warnings
Possible causes:
- Memory leaks
- Unresponsive services
- SQL or IIS overload
- Misconfigured antivirus
2. DNS Issues
Look here:
- System → DNS Client Events → Event ID 1014
- DNS Server Logs (if role installed)
Common symptoms:
- Slow authentication
- GPO failures
- Network slowness
- Cannot resolve domain resources
3. Active Directory & Group Policy Failures
Check logs:
- System → Netlogon
- Application → GroupPolicy
- DFS Replication logs
Look for:
- Event ID 1053 / 1054 – GPO processing errors
- Event ID 5719 – Netlogon issues
4. RDP Login Failures
Security log is key.
Search for:
- Event ID 4625 – Failed login
- Event ID 4771 – Kerberos issues
- Event ID 4648 – Logon attempt with explicit credentials
5. Server Keeps Rebooting
Check:
- System → Event ID 41 – Unexpected reboot
- Event ID 1074 – Process initiated shutdown
- Event ID 6008 – Unexpected shutdown
Also check thermal events, hardware failures, and updates.
Using the “Details” Tab Like a Pro
The friendly view is useful, but the Details tab (XML view) gives:
- Full event context
- Process ID
- Thread ID
- Error parameters
- Linked processes
- Timestamps with microseconds
- Machine GUID
This is essential for deep troubleshooting.
How to Correlate Logs Across Multiple Sources
Successful diagnosis often requires correlating:
- Security logs
- Application logs
- System logs
- Role-specific logs (IIS, DNS, DFS, AD)
Tools that help:
- Event Viewer’s “Find” feature
- Custom Views
- Windows Event Forwarding (WEF)
- Sysmon + SIEM tools
Example: Troubleshooting Kerberos failures
Check:
- Security (4771)
- System (DNS failures)
- Application (service account errors)
Best Practices for Event Viewer on Windows Server
1. Create Custom Views for recurring issues
Examples:
- Active Directory health
- RDP failures
- Disk warnings
- Service failures
2. Archive logs regularly
Prevent log overwrites and enable long-term auditing.
3. Use Increasing Log Sizes
Default log sizes are too small on production servers.
Recommended sizes:
- System: 256 MB
- Application: 512 MB
- Security: 2–4 GB
4. Enable Audit Policies
For security and compliance.
5. Combine Event Viewer with Performance Monitor
To correlate:
- CPU
- Disk I/O
- Memory
- Network
Conclusion: Event Viewer Is the Sysadmin’s Most Powerful Diagnostic Tool
Troubleshooting Windows Server without Event Viewer is like trying to diagnose a car without looking under the hood. Once you know how to read logs, filter intelligently, and correlate events, you gain the ability to solve almost any server issue from performance problems to application crashes to security breaches.
Mastering Event Viewer makes you:
- Faster
- More accurate
- More reliable
- A higher-value SysAdmin
If you want to manage stable, secure, production-ready Windows Server environments, Event Viewer should be your first stop during every investigation.
💬 Have Questions or Feedback? Contact Me Anytime!
If you found this guide helpful or you have questions, comments, or ideas for future Windows Server articles, I’d love to hear from you.
Feel free to reach out directly at:
Your feedback helps me improve the content on SysAdminFAQ.com and bring you even more in-depth troubleshooting guides.